

Imbalances of health workforce across the EU27 - Dashboard (SPPM Methodology)
The Social Policy Performance Monitor (SPPM) methodology makes an explicit assessment, considering both the level and the change of the indicators as compared to the European average. Countries are classified into five bands (very high, high, medium, low, very low). For example, the indicator HWF density (health workforce per capita) shows a Good Social Outcome (GSO) in only two countries (Luxembourg and Finland), but in eight countries a Key Social Challenge (KSC) (Greece, Slovakia, Ireland, Bulgaria, Latvia, Poland, Romania, and Croatia).
Figure: HWF density, SPPM Approach
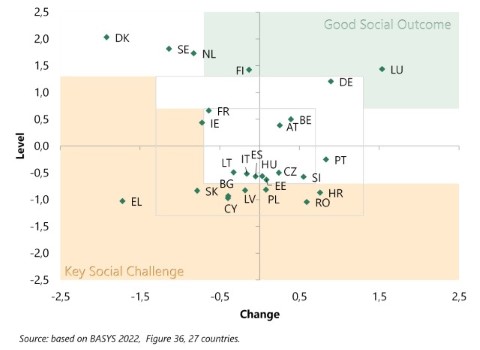
It’s important to note that the identification of Key Social Challenges (KSCs) and Good Social Outcomes (GSOs) takes into account both levels and changes. To capture the relative position of Member States, for each indicator, levels and changes are converted to standard scores (also known as z-scores) to apply the same metric to all the indicators. In the terminology of the EPM the KSCs and GSOs are identified as Key Employment Challenges (KECs) and Good Labour Market Outcomes (GLMOs) while using different cut-off points [1].
Obviously, the assessment of the imbalances differs depending on their assessment framework, their measurement, and the comparative cut-off points to value them. A key question remains therefore, on how to measure cross-country imbalances in health workforce, and to use these measures to address health and employment policy.
Referenzen
[1] European Commission (2021), Annexes to the proposal for a joint Employment Report from the Commission and the Council, Brussels, 24.11.2021, COM(2021) 743 final.
The summary report can be downloaded here: BASYS 2022 - HWF Summary Report.pdf